Smarter Engagements
Stop Losing People in the Middle of Your Meeting.
- Second by second visibility of attention loss and fatigue levels.
- Data match optimal presentation elements to each unique audience.
- Training that you can prove worked, cumulative data reports confirm strategy.
Audience engagement data mapped to every slide, every creative, every word – every second.
Innovation leads to Elevation.
Customers in the $64.4B Natural Language Processing (NLP) market pay for speech transcription, summaries and sentiment from text.
Infergram has developed a proprietary multi-modal computer vision/NLP application to process session data elements, user behaviors, speech, and experiential data. This privacy-first system anonymizes audience feedback to deliver meeting insights and productivity recommendations to hosts and audiences .
Data driven meeting planning, execution and outcomes.
“Engagement Intelligence”
Infergram provides context to critical meeting elements: identify optimal audience makeup, time of day, format, duration, content, and language.

Practical meeting data — name, date, day, subject, duration, total participants, gender split, and age ranges.
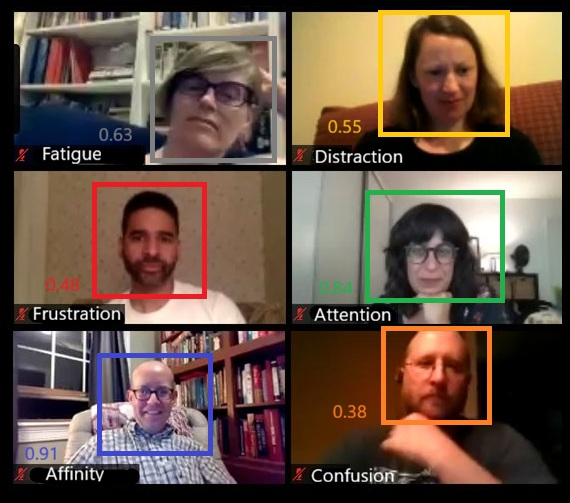
Six biometric engagement metrics — Attention, Distraction, Affinity, Disappointment, Confusion, Fatigue — per session and segmented by gender and age group.
Compare engagement metrics across any combination of gender and age group — per session, daily, weekly, or all-time.
Score, compare and improve every meeting.
Insight pattern recognition of imperceptible behaviors means:
1. Clearer meetings, more effective communication, better training and retention.
2. Meeting efficiency = fewer long meetings, more time for actual work and business.
3. Better team cognitive health with audience attention and fatigue feedback.
4. Cumulative data/pattern recognition drives custom optimization and recommendation data.
Early Beta Access
Connect Infergram to your Zoom Video Meeting profile.
We are developing our product and plan to launch in mid-2026. Please join our beta program and help us understand how to deliver impactful meeting outcomes.
Smarter Engagements
© 2026 Infergram ™